Pie Chart
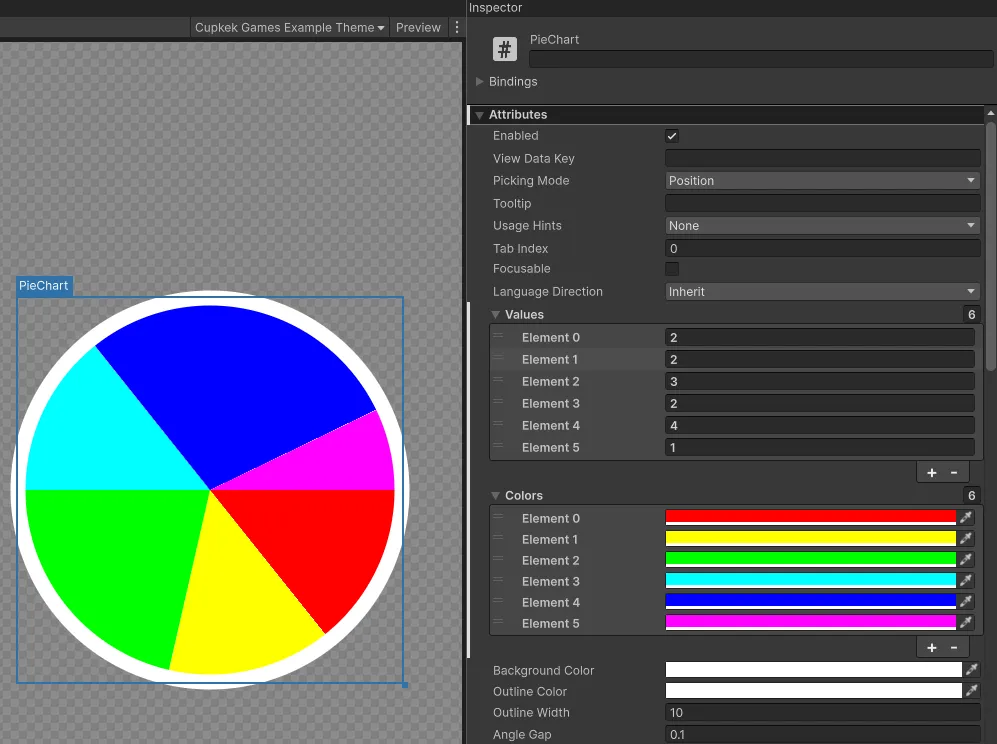
PieChart is a VisualElement that renders a multi-segment circular chart from parallel Values and Colors lists. Values are normalized to total 100% — pass raw counts, not percentages. Each segment exposes a center point you can use for label placement.
Setup
UXML:
html
<luna:PieChart BackgroundColor="#222222" OutlineColor="#FFFFFF" OutlineWidth="4" />Populate from C# (Values and Colors are List<float> / List<Color>):
csharp
var pie = root.Q<PieChart>();
pie.Values = new List<float> { 35f, 25f, 40f };
pie.Colors = new List<Color> { Color.red, Color.green, Color.blue };
Inspector (UxmlAttributes)
| Attribute | Type | Description |
|---|---|---|
Values | List<float> | Raw segment sizes. Auto-normalized; mismatched lengths just paint missing segments black. |
Colors | List<Color> | Per-segment fill colors. |
BackgroundColor | Color | Disc background, drawn beneath segments (default white). |
OutlineColor | Color | Outer-ring stroke color (default white). |
OutlineWidth | float | Outer-ring stroke width in pixels (default 10). |
GapWidth | float | Width of the radial separator drawn between segments (default 0.1). Set to 0 to disable. |
API
Properties
| Property | Type | Description |
|---|---|---|
SegmentCenters | List<Vector2> | Read-only element-space (local) centers of each rendered segment (positioned at 2/3 of the radius along the segment's mid-angle). |
Events
| Event | Description |
|---|---|
OnSegmentCentersChanged | Fires after each repaint. Subscribe to update overlay labels positioned at SegmentCenters[i]. |
See also
- ProgressBar — single-value variant with brand-themed presets
Settings
Theme
Light
Contrast
Material
Dark
Dim
Material Dark
System
Sidebar(Light & Contrast only)
Font Family
DM Sans
Wix
Inclusive Sans
AR One Sans
Direction
Left to RightLTR
Right to LeftRTL